The corridor unfolds in four sequences, each addressing oil and energy data through a distinct aesthetic and sensory register.
Each sequence is reactive to the visitor's presence and movements. Their movements are detected, a visual signature is assigned to them, and the installation is built around them in real time.
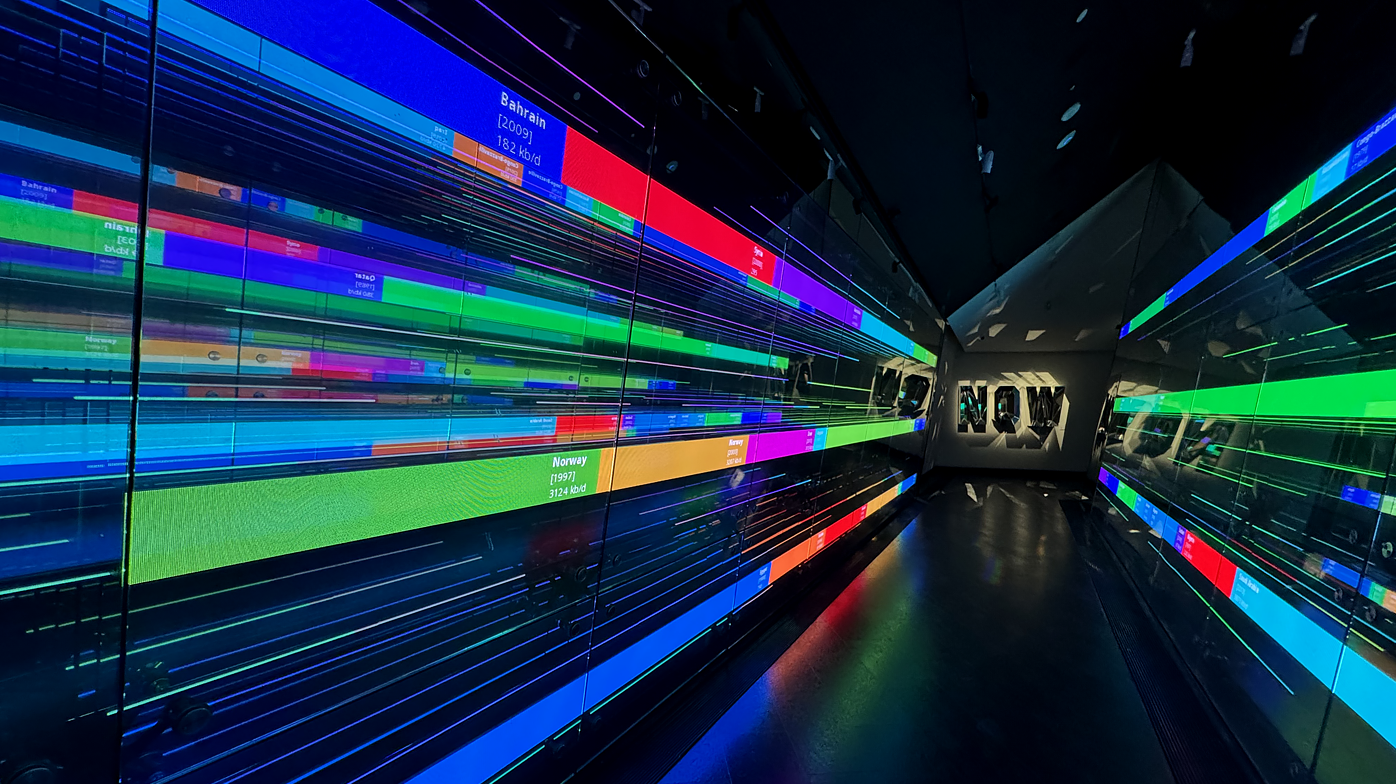
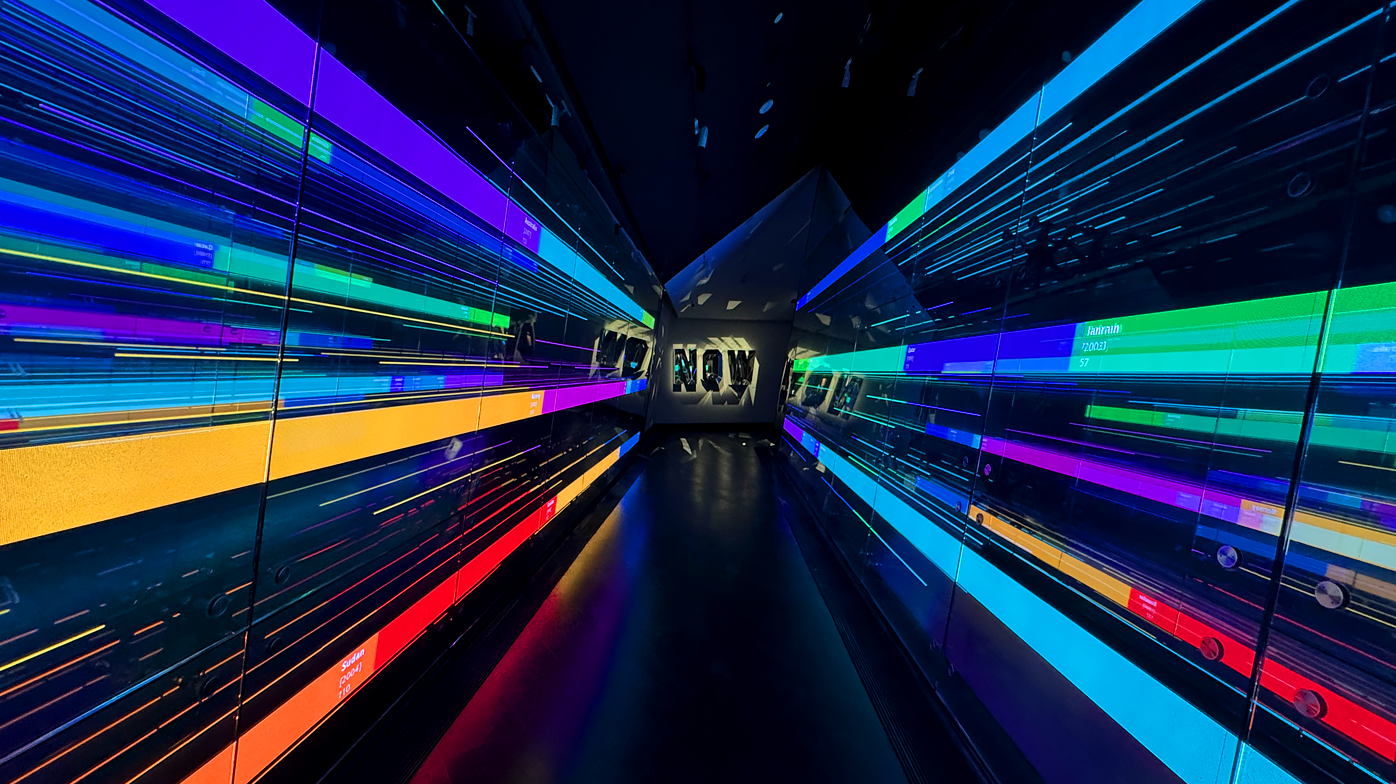
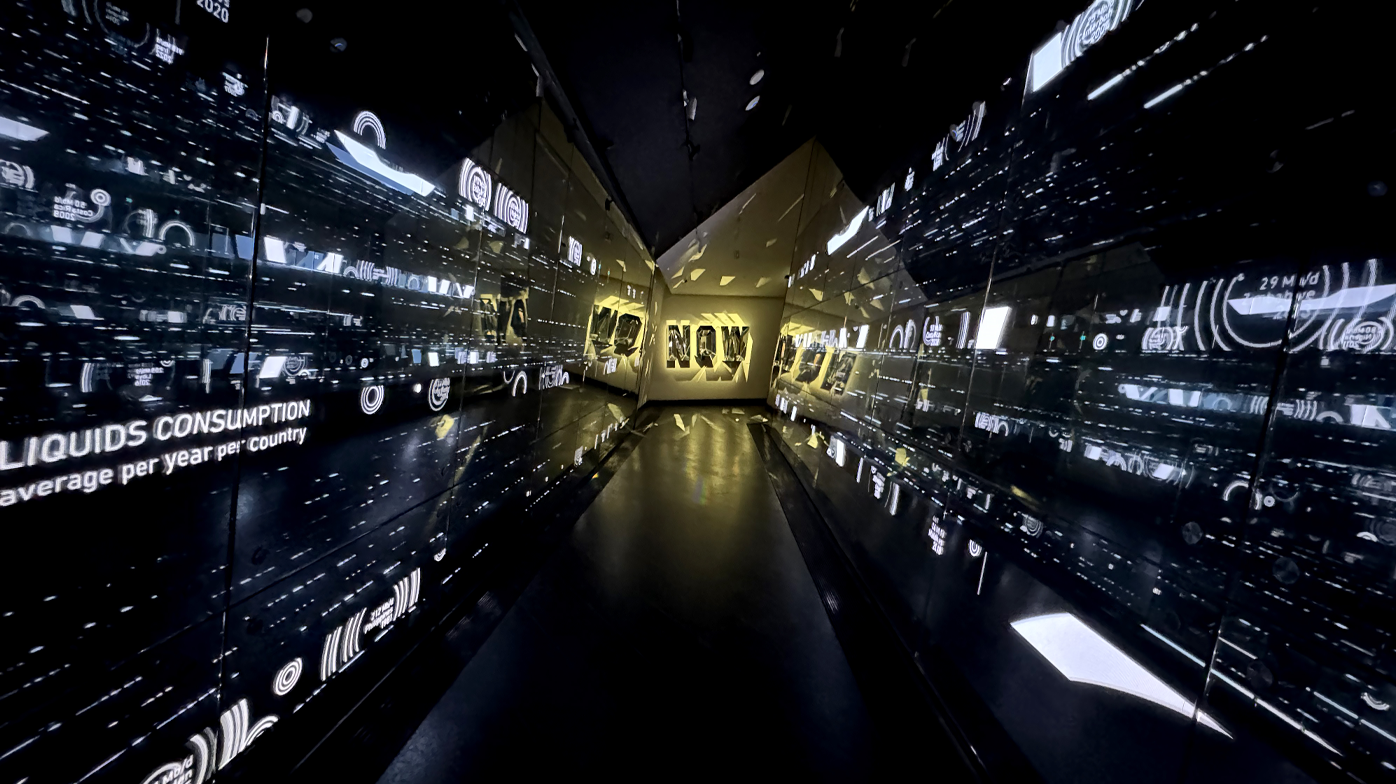
In Diagram, bars of colored light represent 50 years of global crude oil production. As the visitor moves forward, the dates shift, countries appear, and quantities fluctuate.
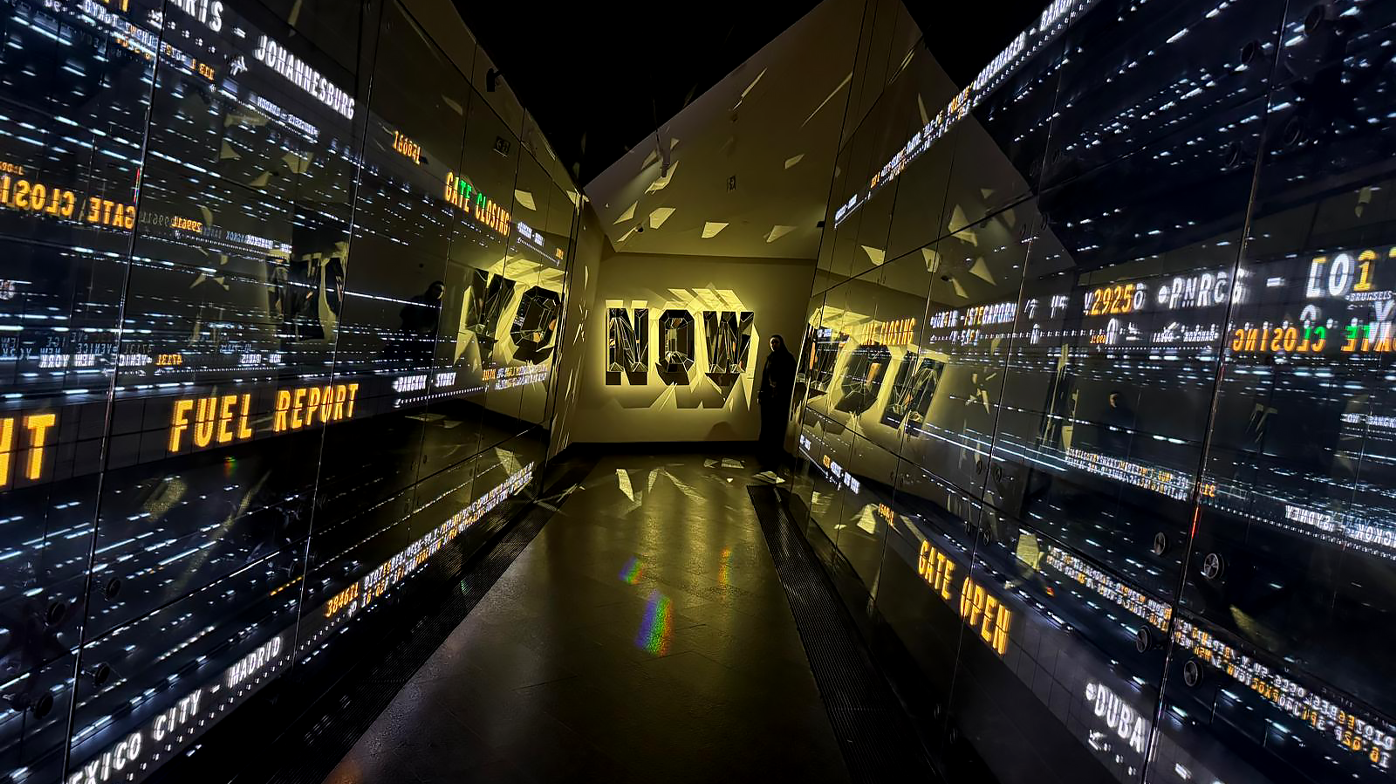
In Ai.rport, the corridor becomes an international terminal where kerosene consumption per flight is displayed in real time in the language of departure boards.
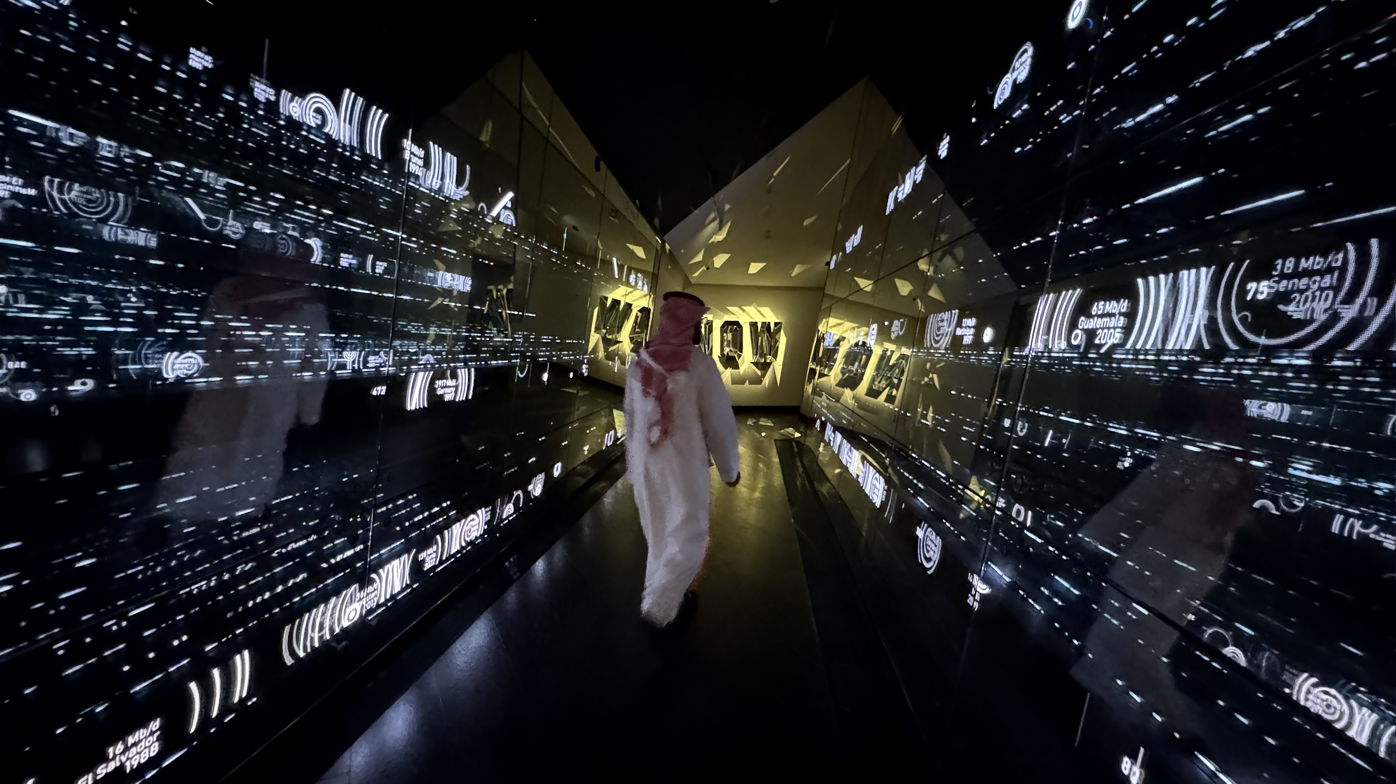
In Rain, it is raining. The visitor's steps reveal circular waves at body level, as if they were walking through a puddle. At the heart of some of these ripples appears a raw piece of data: a country, a year, a quantity of oil consumed.
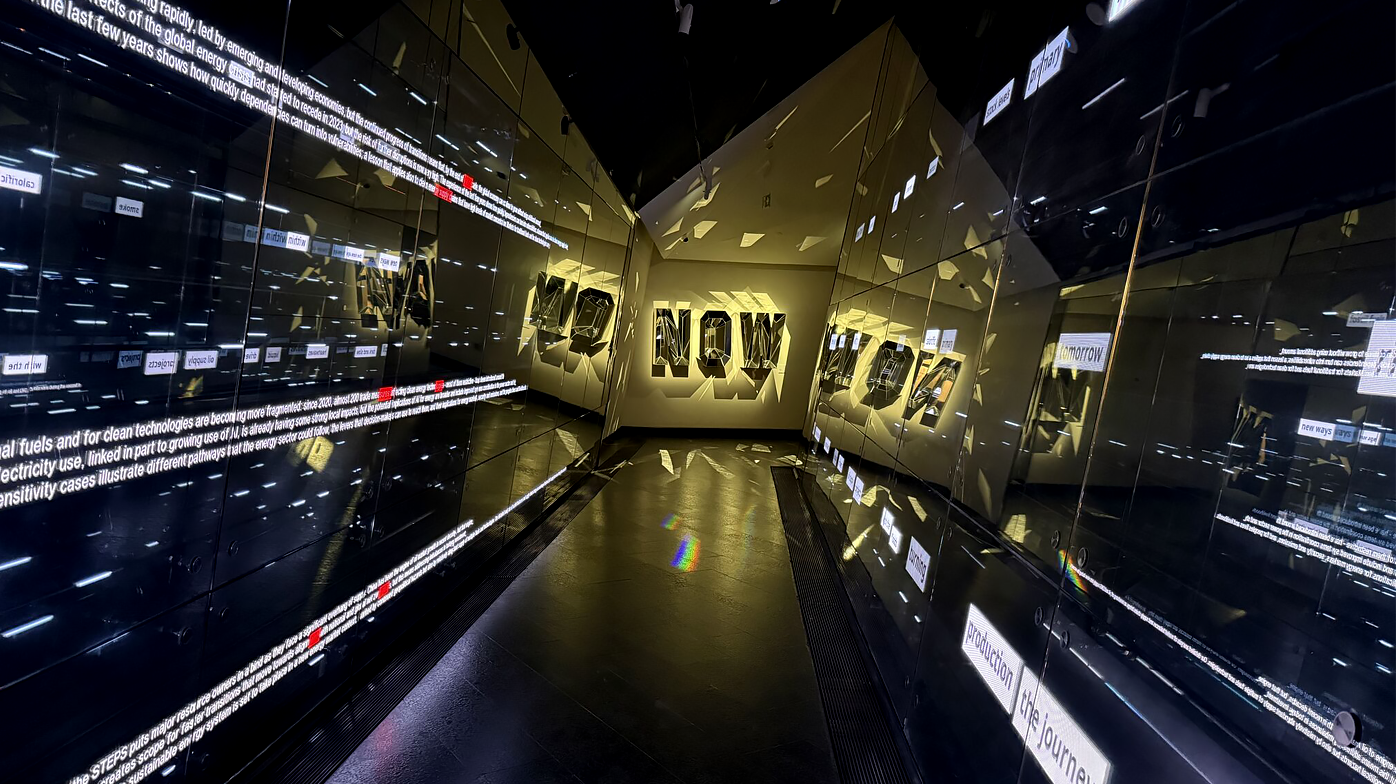
In Poetic Data, technical reports are subjected to automated processing that extracts their latent vocabulary and distills it into fragments akin to haiku. The bureaucratic and the lyrical confront each other in this same corridor.
Throughout the sequences, small LED strips pulse in points of light, evoking binary code and the logic of punched cards, a reminder that every image, every word, every piece of data displayed on these walls is computation made visible.
The installation relies on a detection system that tracks the position and movement of visitors in real time along the entire length of the corridor. The visitor's physical progress in the corridor becomes the cursor for reading a 50-year chronology of data. When they stop, the data freezes. When they move forward, it changes.